Development
Accessing Application Logs
It's helpful to have acess to the application logs when debugging a ToDesktop Builder application. By default, ToDesktop writes logs to the following locations:
- on Linux: ~/.config/[app name]/logs/main.log
- on macOS: ~/Library/Logs/[app name]/main.log
- on Windows: %USERPROFILE%\AppData\Roaming\[app name]\logs\main.log
These can be accessed via the command line terminal. For example, printing macOS logs for an application title "Example App" can be done as follows:
You can also use Chrome's developer tools to view these logs. This would allow you to take advantage of additional features, such as using breakpoints and navigating source files. Doing this requires locating the application exectuable and running it from the command line with an --inspect=5858 flag.
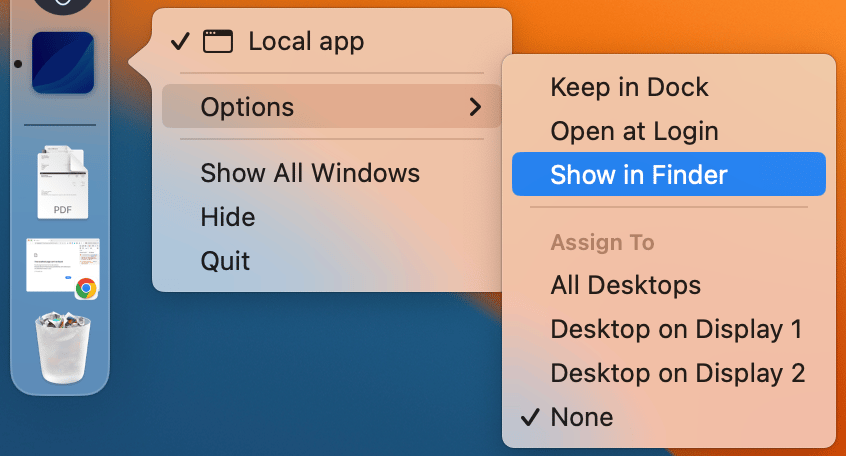
To locate the executable, you'll first need to create it by running your application in ToDesktop Builder. Once created, you'll then need to find the location of the app executable. This can be done in macOS by right-clicking the app that appears on the dock, and showing it in the finder. Something similar can be done on Windows and Linux.
Once you've located your application in the finder, you can then close your current application. This is important, otherwise you'll be running two instances of your application.
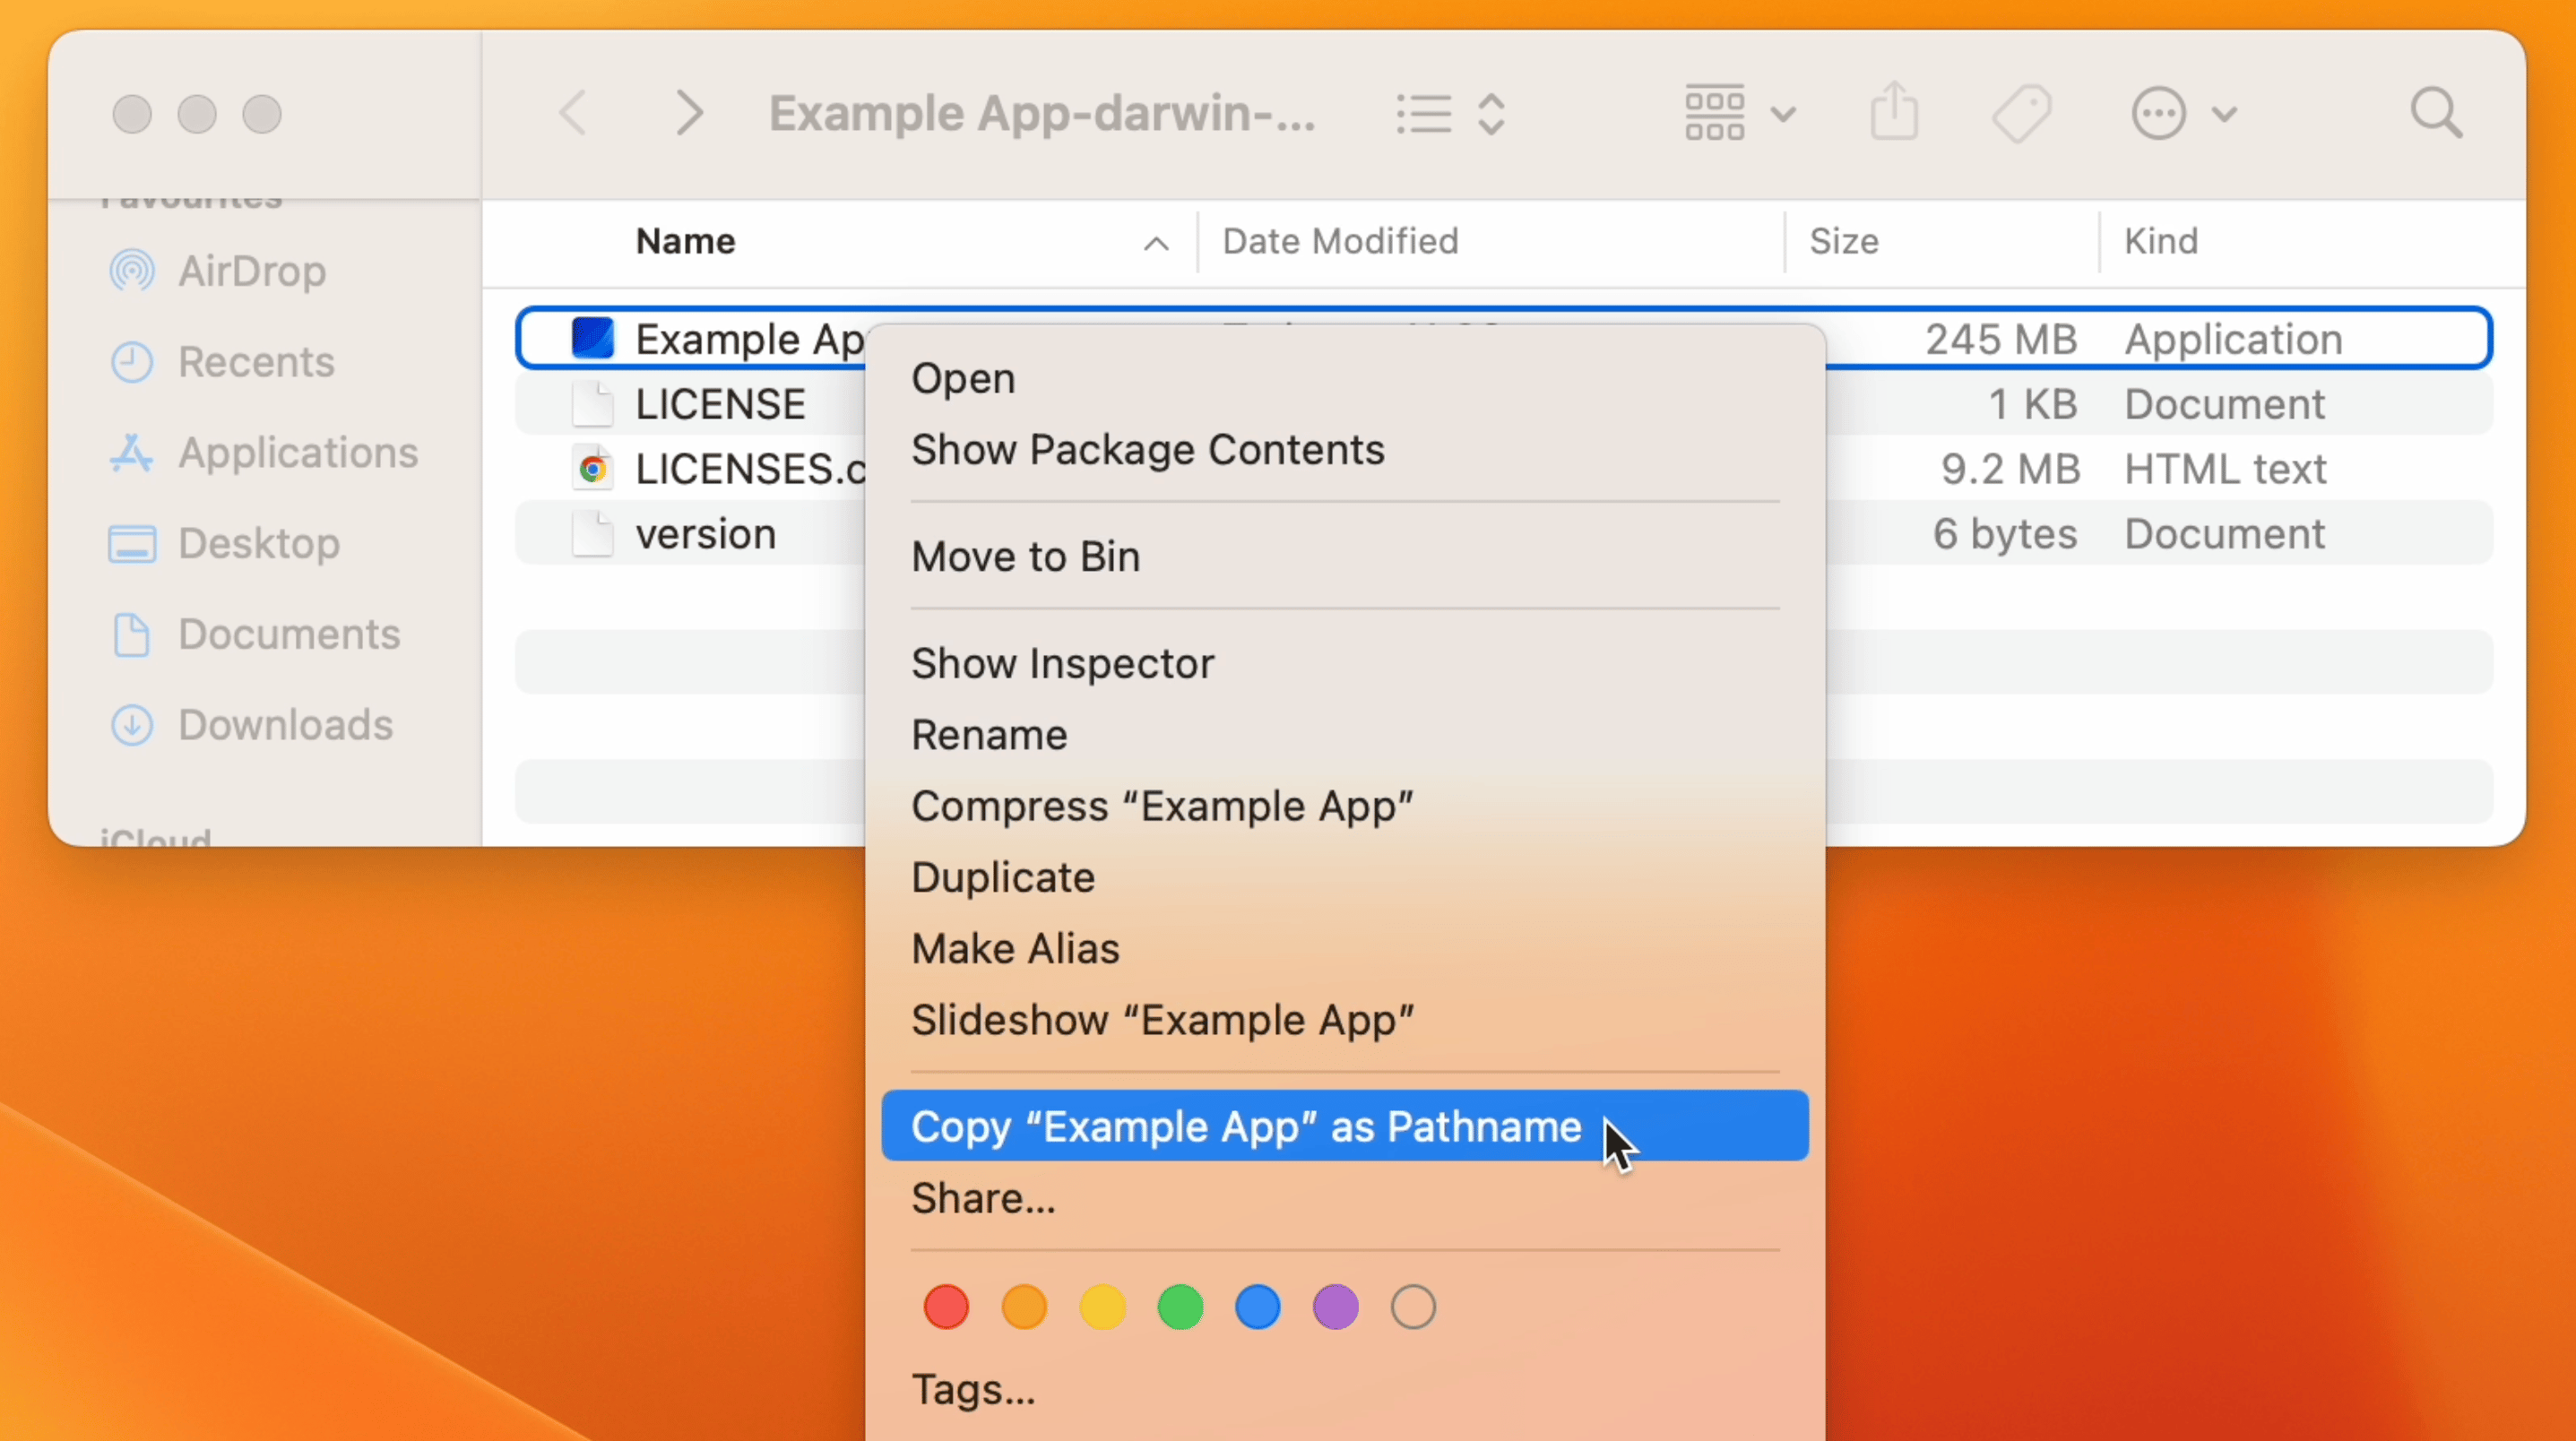
Once that's done, right-click on the application icon that has appeared in your file window to reveal the context menu. Once the context menu is revealed, hold down the Option key on your keyboard. This will reveal a menu item called Copy "App Name" as pathname.
Open your terminal and cd to the copied pathname, which was the following in my case:
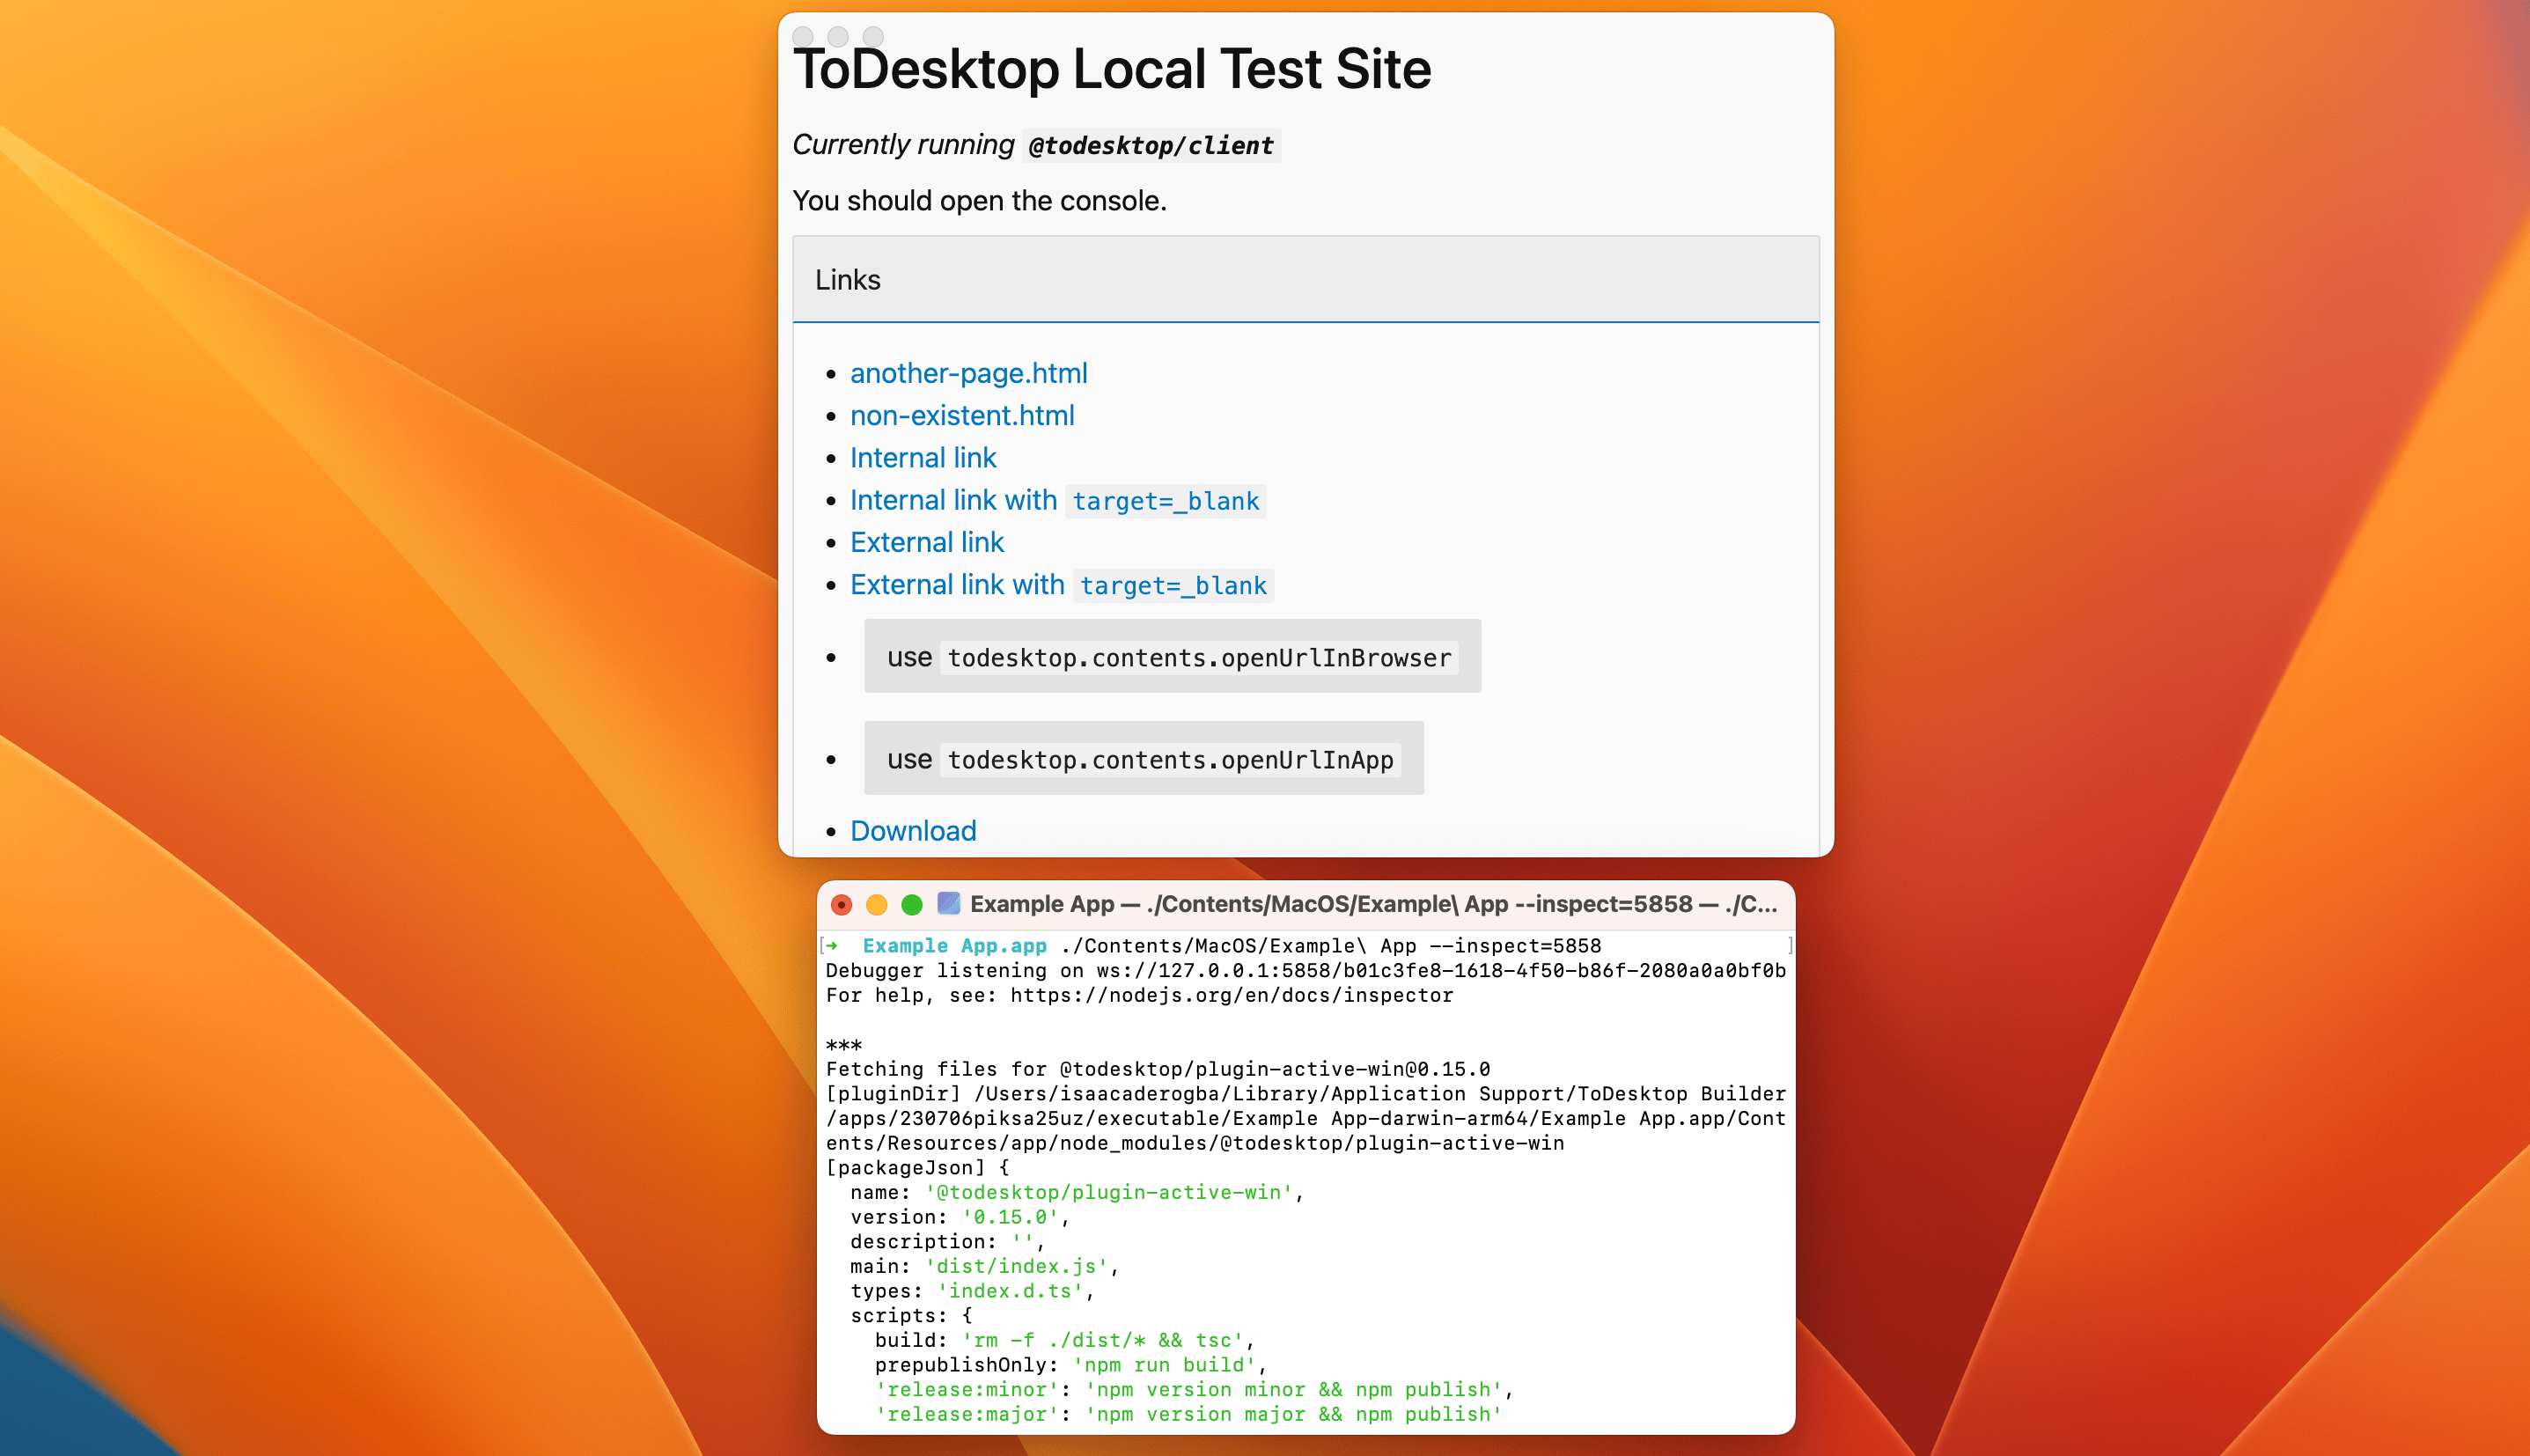
You can then run the following command with the --inspect=5858 flag, replacing Example App with your application name:
This will both start the application, as well as log any outputs in the current terminal window:
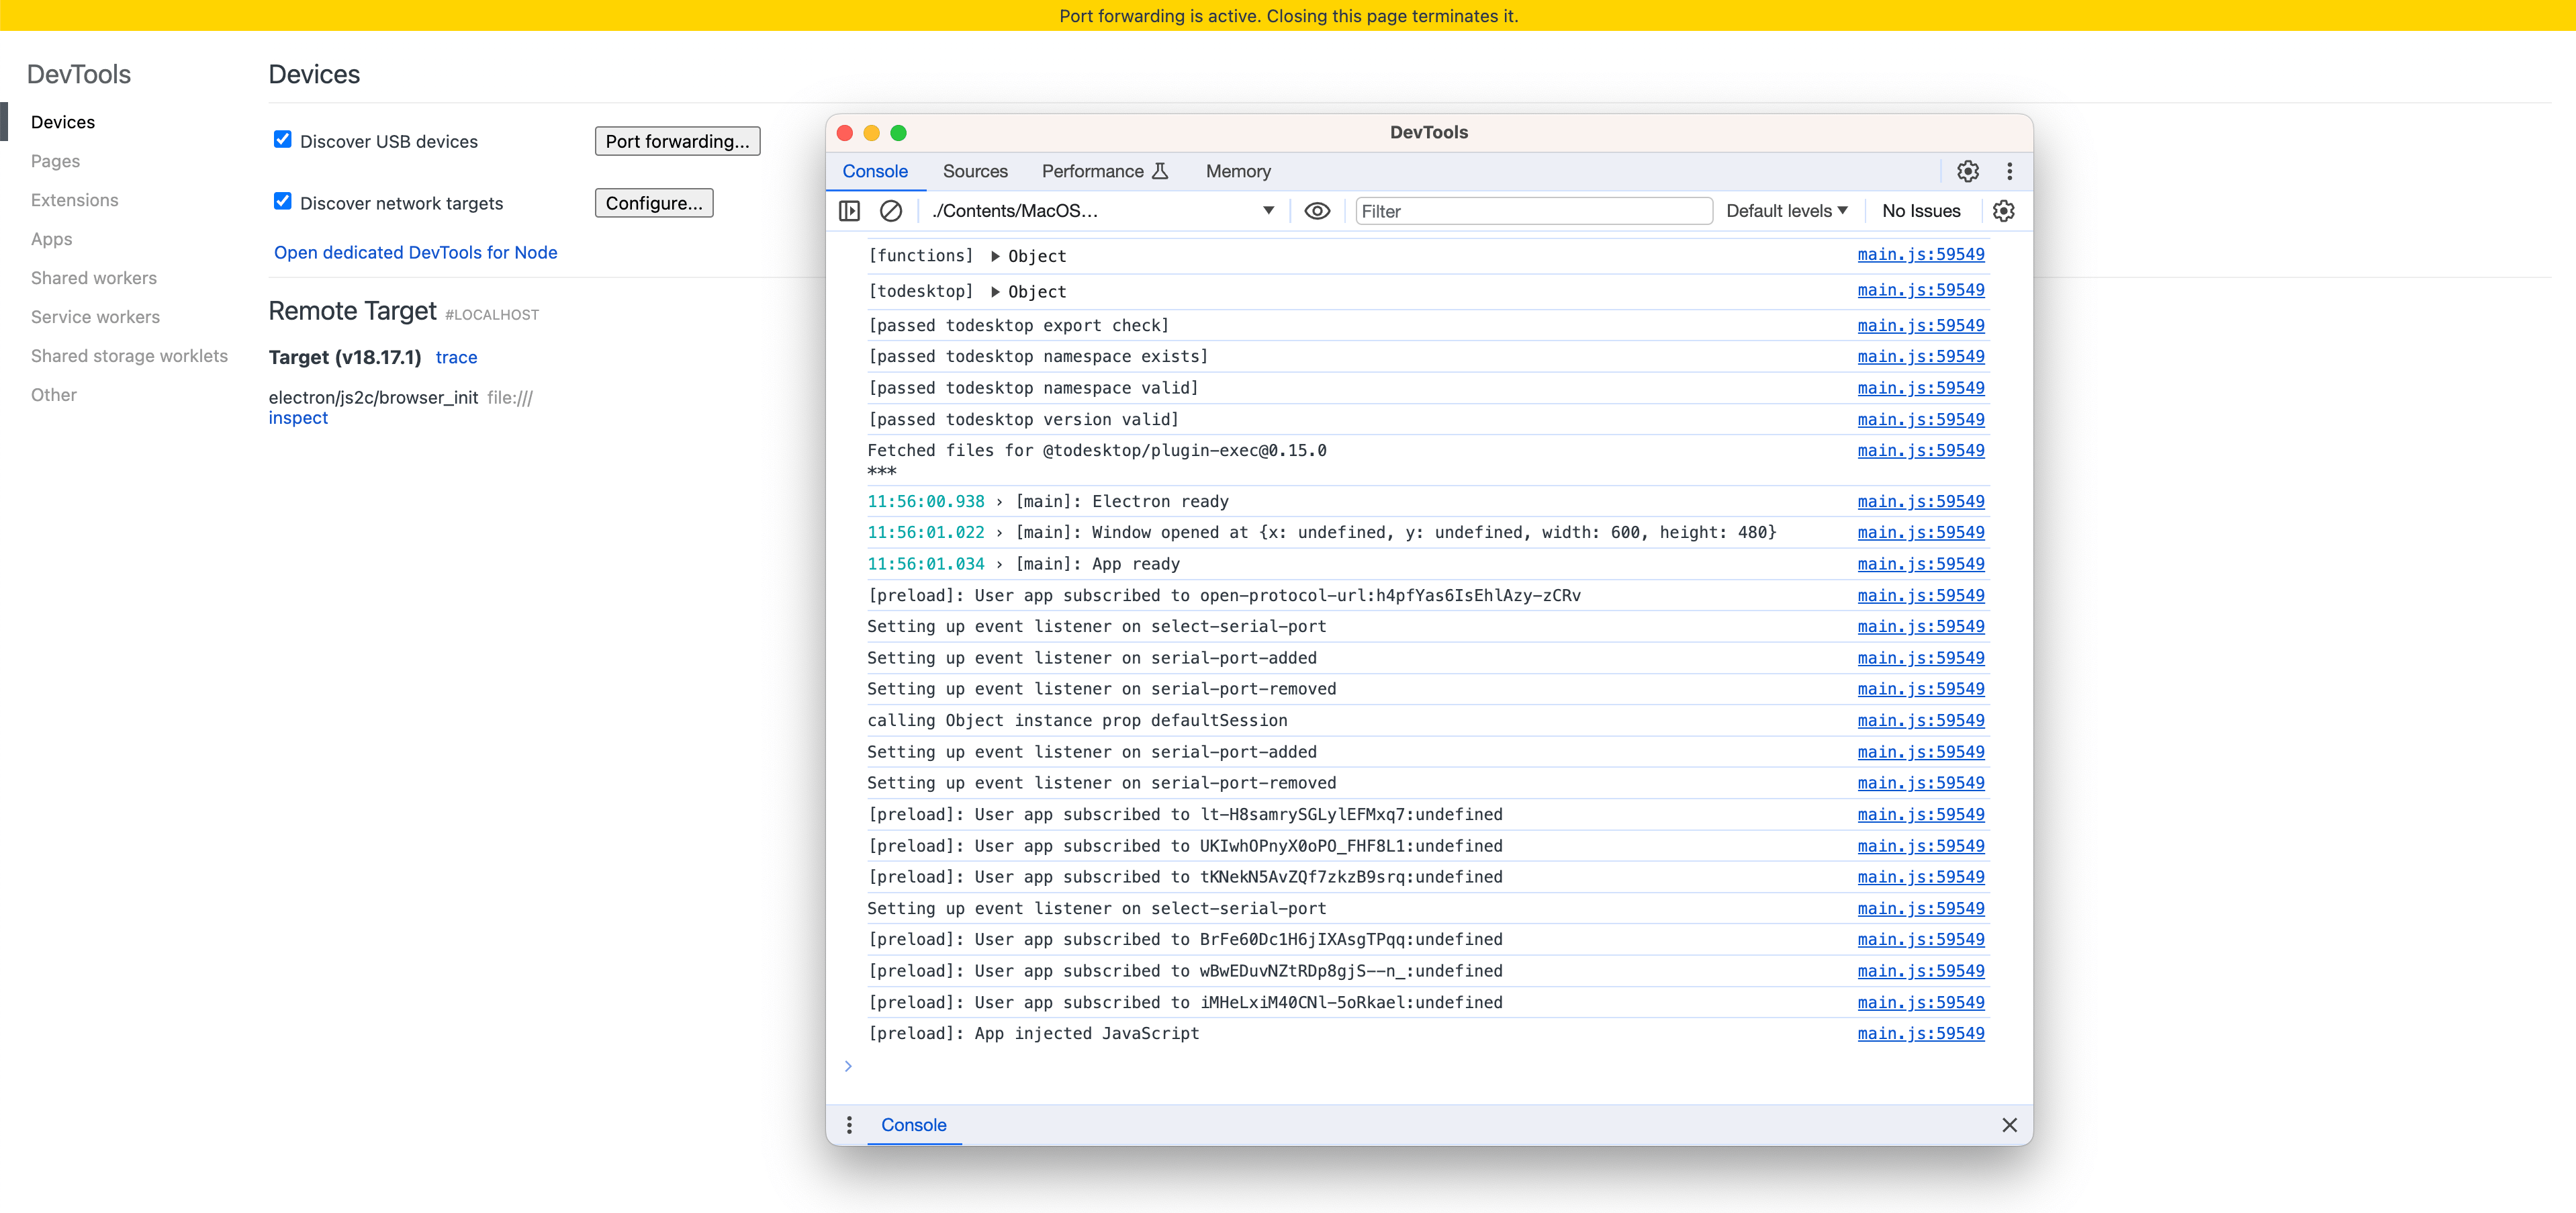
You can go one step further and instead have the logs redirected to your chrome developer tools. Open a new Google Chrome window and navigate to chrome://inspect/#devices. Click the configure button and add localhost:5858 to the discovery settings. Also make sure to enable port forwarding.
You should then see an Inspect button that, when clicked, will show your logs in the more familiar chrome developer tools: