Development
Debugging Your App
A comprehensive guide to debugging ToDesktop applications during development and in production.
Overview
ToDesktop apps have two processes you may need to debug:
- Renderer process — Your web app running in Chromium. Debug this like you would a web app, using Chrome DevTools.
- Main process — The Node.js process that manages windows, native features, and system integration. Debug this using Node.js debugging tools.
Debugging the Renderer Process
The renderer process is where your web app runs. You can debug it using Chrome DevTools, just like debugging a website.
Opening DevTools
There are several default ways to open DevTools in your ToDesktop app if DevTools are enabled in your application config:
- Via the View menu — Click View → Toggle Developer Tools
- Via keyboard shortcut — Use
Cmd+Option+I(macOS) orCtrl+Shift+I(Windows/Linux) - Programmatically — Call
webContents.toggleDevTools()from your code
Once open, you have access to the full Chrome DevTools suite: Console, Elements, Network, Sources, and more.
DevTools can be disabled for production builds. See Using Chrome Developer Tools for configuration options.
Renderer Process Logs
Console logs from your web app (e.g., console.log()) appear in the DevTools Console tab. These are not written to disk by default.
Debugging the Main Process
The main process handles native functionality, window management, and system integration. Debugging it requires connecting a Node.js debugger.
During Local Development
When running your app locally via ToDesktop Builder, you can use the "Show in Finder" option to locate the executable:
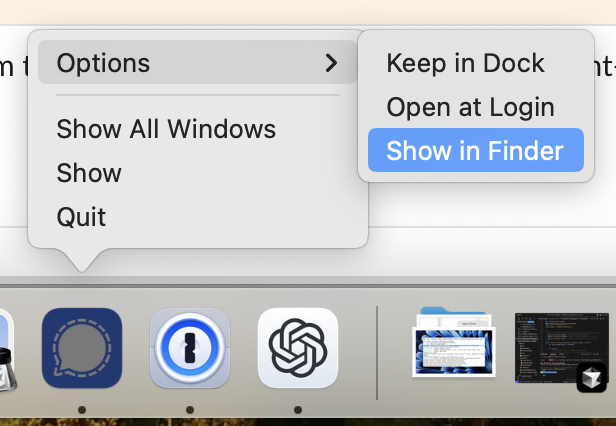
Then run it from the terminal with the --inspect flag:
Debugging an Installed App
For apps installed on a user's machine (or your own machine for testing), you can attach a debugger the same way:
macOS:
Windows:
Linux:
Connecting Chrome DevTools to the Main Process
Once your app is running with --inspect=5858:
- Open Google Chrome and navigate to
chrome://inspect/#devices - Click Configure and add
localhost:5858to the target discovery settings - Enable port forwarding
- Your app should appear under "Remote Target" — click Inspect
This gives you a full DevTools window connected to the main process, where you can set breakpoints, inspect variables, and step through code.
Log File Locations
ToDesktop writes main process logs to disk. These are invaluable for debugging issues in production.
Main Process Logs
Reading logs from the terminal:
Tailing logs in real-time:
Renderer Process Logs
Renderer process logs (console.log(), etc.) are only visible in DevTools and are not written to disk by default.
Simulating Auto-Updates
Testing auto-update behaviour normally requires publishing a release, which is slow and cumbersome. ToDesktop Builder lets you simulate auto-update events locally.
Enabling Simulation Mode
- In ToDesktop Builder, click the vertical ellipsis (⋮) next to the Run button
- Select Simulate auto-update events locally
- Run your app
This triggers a simulated update sequence when the app starts:
checking-for-updateupdate-availabledownload-progressupdate-downloaded
If you restart the app via the update prompt (or programmatically), you'll get the update-not-available sequence, simulating a post-update launch.
Listening to Update Events
You can listen to these events to test your update UI:
See Configuring Auto-Updates for more details.
Debugging Tips
- Add version logging — Log your app version on startup so you know which version generated a log file
- Use structured logging — Include timestamps and log levels to make logs easier to parse
- Test on all platforms — Issues often appear on only one platform
- Keep DevTools enabled during development — If you want to disabled it then disable only for production releases. Often it's best to keep it enabled even for production builds though.